2025: the latest complete year
The Michigan State Police 2025 County Crash Report, created May 5, 2026, covers every reported crash from January 1 through December 31, 2025.
| County | Total crashes | Fatal crashes | Injury crashes | People killed | People injured |
|---|---|---|---|---|---|
| Oakland | 35,292 | 80 | 6,660 | 84 | 9,074 |
| Wayne | 49,282 | 151 | 11,079 | 159 | 15,682 |
| Macomb | 21,230 | 50 | 4,613 | 52 | 6,455 |
| Michigan (all counties) | 290,221 | 1,002 | 50,774 | 1,065 | 70,591 |
Statewide, deaths fell 3% from 1,099 in 2024 to 1,065 in 2025, and suspected serious injuries fell 3% from 5,781 to 5,631, while total crashes rose 0.5%. The 2025 county report does not break out serious injuries by county.
2024: deaths and serious injuries
Michigan Traffic Crash Facts publishes county profiles that separate suspected serious (“A”) injuries. The 2024 profiles are the most recent available.
| County | Total crashes | Fatal crashes | People killed | Serious-injury crashes | People seriously injured |
|---|---|---|---|---|---|
| Oakland | 35,951 | 61 | 68 | 435 | 509 |
| Wayne | 50,355 | 166 | 177 | 792 | 926 |
| Macomb | 21,960 | 68 | 70 | 288 | 333 |
The trend since 2020
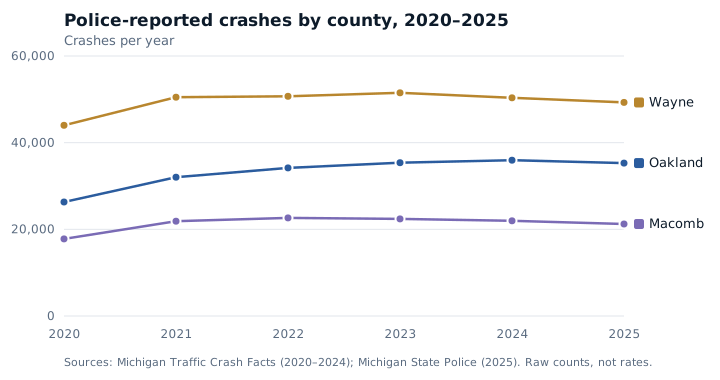
Total crashes were lowest in 2020 in all three counties, then climbed back. Oakland County rose every year from 2020 through 2024 before dipping in 2025. Wayne and Macomb peaked in 2023 and 2022 and have eased since.
| Year | Oakland crashes (fatal) | Wayne crashes (fatal) | Macomb crashes (fatal) |
|---|---|---|---|
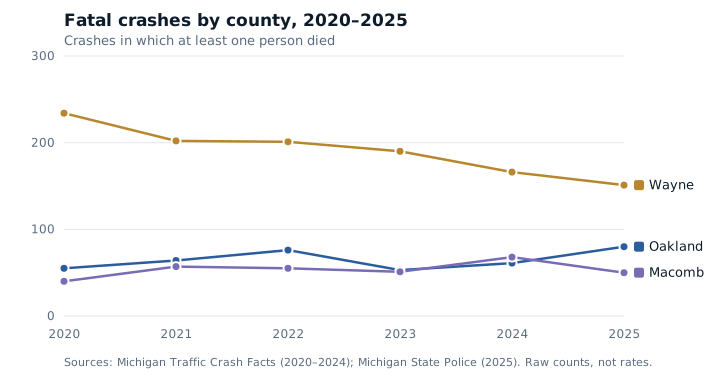
| 2020 | 26,316 (55) | 44,017 (234) | 17,796 (40) |
| 2021 | 32,037 (64) | 50,489 (202) | 21,871 (57) |
| 2022 | 34,185 (76) | 50,697 (201) | 22,628 (55) |
| 2023 | 35,386 (53) | 51,507 (190) | 22,405 (51) |
| 2024 | 35,951 (61) | 50,355 (166) | 21,960 (68) |
| 2025 | 35,292 (80) | 49,282 (151) | 21,230 (50) |
Figures in parentheses are fatal crashes, which can be fewer than people killed because one crash can kill more than one person. Fatal crashes in Wayne County fell every year in this period, from 234 in 2020 to 151 in 2025. Oakland’s 80 fatal crashes in 2025 were the highest in the six years shown. County totals change slightly as late reports are added, so a later edition of the same report can differ by a few crashes.
2020 through 2024 come from the Michigan Traffic Crash Facts county profiles; 2025 comes from the Michigan State Police 2025 County Crash Report. Both are built from the same UD-10 police reports.
The three counties’ share of Michigan crashes
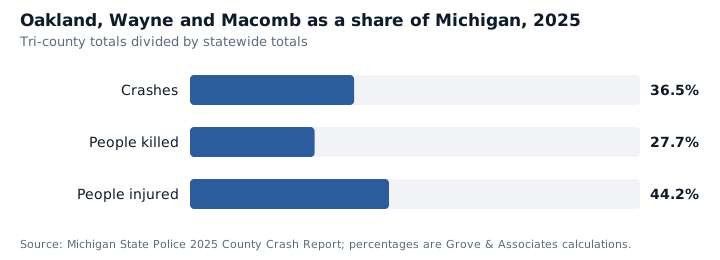
Using the 2025 State Police figures, the tri-county area accounted for about 36% of Michigan’s crashes, 28% of its traffic deaths and 44% of the people injured in crashes.
| County | Share of state crashes | Share of state deaths | Share of people injured |
|---|---|---|---|
| Oakland | 12.2% | 7.9% | 12.9% |
| Wayne | 17.0% | 14.9% | 22.2% |
| Macomb | 7.3% | 4.9% | 9.1% |
Percentages are our calculation from the 2025 County Crash Report totals above.
2024 by community
We pulled the 2024 municipality tables from the Michigan Traffic Crash Facts county profiles for the 84 metro Detroit communities we cover (cities and townships of 15,000 or more people in Oakland, Wayne, Macomb, Washtenaw, Livingston and Genesee counties). These are the ten with the most police-reported crashes and the ten with the most people killed.
| Community | County | Crashes, 2024 | People killed | Seriously injured | Pedestrian crashes |
|---|---|---|---|---|---|
| Detroit | Wayne | 24,321 | 104 | 539 | 420 |
| Warren | Macomb | 4,086 | 13 | 68 | 31 |
| Sterling Heights | Macomb | 3,748 | 8 | 52 | 20 |
| Dearborn | Wayne | 3,326 | 4 | 43 | 33 |
| Southfield | Oakland | 3,313 | 10 | 32 | 31 |
| Livonia | Wayne | 3,033 | 10 | 32 | 14 |
| Ann Arbor | Washtenaw | 2,770 | 5 | 36 | 56 |
| Farmington Hills | Oakland | 2,672 | 3 | 20 | 10 |
| Flint | Genesee | 2,531 | 24 | 47 | 37 |
| Troy | Oakland | 2,480 | 7 | 35 | 16 |
| Community | County | People killed, 2024 | Fatal crashes | Crashes |
|---|---|---|---|---|
| Detroit | Wayne | 104 | 98 | 24,321 |
| Flint | Genesee | 24 | 23 | 2,531 |
| Warren | Macomb | 13 | 12 | 4,086 |
| Taylor | Wayne | 12 | 11 | 1,916 |
| Southfield | Oakland | 10 | 8 | 3,313 |
| Livonia | Wayne | 10 | 10 | 3,033 |
| Sterling Heights | Macomb | 8 | 8 | 3,748 |
| Clinton Township | Macomb | 8 | 8 | 1,907 |
| Shelby Township | Macomb | 8 | 7 | 1,814 |
| Troy | Oakland | 7 | 7 | 2,480 |
Large cities lead these lists largely because of size and through traffic, so the counts are not a safety ranking. Crashes are counted where they happened, not where the drivers live, and interstate crashes inside a city's limits count toward that city. Each community page has its full 2024 table, and you can download all 84 communities as a CSV file.
Method and limitations
- Sources. 2020 to 2024: Michigan Traffic Crash Facts county profiles (published by the University of Michigan Transportation Research Institute for the Michigan Office of Highway Safety Planning). 2025: Michigan State Police 2025 County Crash Report, created May 5, 2026; the Oakland, Wayne, Macomb and statewide rows were re-checked against it on October 23, 2026.
- What is counted. Police-reported crashes from UD-10 reports. Unreported crashes are not included. "Fatal crashes" and "people killed" differ because one crash can kill more than one person.
- Revisions. Totals change slightly as late reports arrive, so another edition of the same report can differ by a few crashes.
- Community data. City and township tables are only published through 2024 so far. St. Clair County's 2024 profile could not be retrieved, so Port Huron is left out.
- Our calculations. The percentages and rankings are ours, computed from the published totals. Download the county series as a CSV file.
- Checked. October 22, 2026.
For reporters and researchers
You’re welcome to use these figures and charts with attribution: “Compiled by Grove and Associates PLC from Michigan State Police and Michigan Traffic Crash Facts data.” Please cite the original public sources as well.
- County series, 2020–2025 (CSV)
- 84 metro Detroit communities, 2024 (CSV)
- Charts (SVG): crashes by county, fatal crashes by county, tri-county share of Michigan
Questions about the method, or about Michigan no-fault law: call 313.733.1204. Compiled by Grove and Associates PLC; attorney responsible for this page: Justin Grove.
Intersections with the most crashes
SEMCOG ranks the region’s intersections by reported crashes. See Metro Detroit’s most dangerous intersections for the list and the 2024 intersection death and serious-injury figures.
Finding data for your own city or road
You can look up local figures yourself. Michigan Traffic Crash Facts publishes county and community summaries and a query tool. The State Police offer the Michigan Traffic Crash Dashboard, with ten years of history and a crash map, and the Michigan Traffic Crash Analysis Tool (Mi-CAT). For data the public tools do not show, the State Police Traffic Crash Reporting Unit takes requests at 517-241-1699.
How crash data is used in a claim
The UD-10 crash report
Every police agency in Michigan records reportable crashes on the State of Michigan Traffic Crash Report, form UD-10. It identifies the drivers and vehicles involved and records the officer’s account of the crash. Buy a copy through the Michigan State Police Traffic Crash Purchasing System for $15. You will need search details such as the incident number from the responding agency, and reports usually take 3 to 30 days to appear. The State Police crash unit cannot change a report; corrections go to the agency that wrote it.
Records from the police agency
The responding department may hold more than the UD-10: body and dash camera video, photos, supplemental reports and 911 recordings. These are requested under Michigan’s Freedom of Information Act. The agency must respond within 5 business days and may take one extension of up to 10 business days. Ask early. Some recordings are not kept long.
Traffic signal timing records
When a crash turns on who had the green light, the signal timing records for that intersection can confirm or contradict a driver’s account. They are held by the public agency that operates the signal and can be requested under FOIA. Ask for the timing in effect on the crash date.
Location history
A pattern of similar crashes at the same spot can support a claim involving a road defect or a government agency, where notice deadlines are short. For an ordinary claim against a driver, fault still comes down to the evidence from your own crash, and shared fault reduces what you recover under comparative fault rules.
Your PIP benefits do not depend on who caused the crash. To start a claim, see the first 30 days after a crash or contact us.
Sources: Michigan State Police, Criminal Justice Information Center, 2025 County Crash Report (year-end, created 5/5/2026) and 2024–2025 Year-End Comparison; Michigan Traffic Crash Facts 2024 county profiles for Oakland, Wayne and Macomb counties; Michigan State Police, Traffic Crash Reporting Unit FAQ and Traffic Crash Purchasing System; House Fiscal Agency, MSP Traffic Crash Report Fees (March 2026); Freedom of Information Act, MCL 15.235.
Questions people ask us
Which Metro Detroit county has the most crashes?
Wayne County. Michigan State Police counted 49,282 crashes there in 2025, compared with 35,292 in Oakland County and 21,230 in Macomb County. Wayne also had the most traffic deaths, with 159.
How do I get the police report for my crash?
Ask the police agency that responded how it sells copies of the crash report (form UD-10). Many agencies use the Michigan State Police Traffic Crash Purchasing System, and many Oakland County departments use the county’s CLEMIS portal. You need details such as the incident number from the police agency that responded. Reports usually appear 3 to 30 days after the crash.
What if the police report is wrong?
The State Police crash unit cannot change a report. Corrections must be requested from the police agency that wrote it, and that agency decides whether to amend it. Other evidence, such as photos, witness statements and video, can still prove what happened.
Does crash data about an intersection help my case?
It can give context, such as a history of similar crashes at a signal. It does not prove who was at fault in your crash. Fault is decided from the evidence about your crash itself.